-
About Streets
- Introduction
- Defining Streets
-
Shaping Streets
- The Process of Shaping Streets
- Aligning with City and Regional Agendas
- Involving the Right Stakeholders
- Setting a Project Vision
- Communication and Engagement
- Costs and Budgets
- Phasing and Interim Strategies
- Coordination and Project Management
- Implementation and Materials
- Management
- Maintenance
- Institutionalizing Change
- Measuring and Evaluating Streets
-
Street Design Guidance
- Designing Streets for Great Cities
- Designing Streets for Place
-
Designing Streets for People
- Utilities and Infrastructure
- Operational and Management Strategies
- Design Controls
-
Street Transformations
- Streets
-
Intersections
- Intersection Design Strategies
- Intersection Analysis
- Intersection Redesign
- Mini Roundabout
- Small Raised Intersection
- Neighborhood Gateway Intersection
- Intersection of Two-Way and One-Way Streets
- Major Intersection: Reclaiming the Corners
- Major Intersection: Squaring the Circle
- Major Intersection: Cycle Protection
- Complex Intersection: Adding Public Plazas
- Complex Intersection: Improving Traffic Circles
- Complex Intersection: Increasing Permeability
- Resources
Global Street Design Guide
-
About Streets
- Introduction
- Defining Streets
-
Shaping Streets
Back Shaping Streets
- The Process of Shaping Streets
- Aligning with City and Regional Agendas
- Involving the Right Stakeholders
- Setting a Project Vision
- Communication and Engagement
- Costs and Budgets
- Phasing and Interim Strategies
- Coordination and Project Management
- Implementation and Materials
- Management
- Maintenance
- Institutionalizing Change
-
Measuring and Evaluating Streets
Back Measuring and Evaluating Streets
-
Street Design Guidance
-
Designing Streets for Great Cities
Back Designing Streets for Great Cities
-
Designing Streets for Place
Back Designing Streets for Place
-
Designing Streets for People
Back Designing Streets for People
- Comparing Street Users
- A Variety of Street Users
-
Designing for Pedestrians
Back Designing for Pedestrians
- Designing for Cyclists
-
Designing for Transit Riders
Back Designing for Transit Riders
- Overview
- Transit Networks
- Transit Toolbox
-
Transit Facilities
Back Transit Facilities
-
Transit Stops
Back Transit Stops
-
Additional Guidance
Back Additional Guidance
-
Designing for Motorists
Back Designing for Motorists
-
Designing for Freight and Service Operators
Back Designing for Freight and Service Operators
-
Designing for People Doing Business
Back Designing for People Doing Business
-
Utilities and Infrastructure
Back Utilities and Infrastructure
- Utilities
-
Green Infrastructure and Stormwater Management
Back Green Infrastructure and Stormwater Management
-
Lighting and Technology
Back Lighting and Technology
-
Operational and Management Strategies
Back Operational and Management Strategies
- Design Controls
-
Street Transformations
-
Streets
Back Streets
- Street Design Strategies
- Street Typologies
-
Pedestrian-Priority Spaces
Back Pedestrian-Priority Spaces
-
Pedestrian-Only Streets
Back Pedestrian-Only Streets
-
Laneways and Alleys
Back Laneways and Alleys
- Parklets
-
Pedestrian Plazas
Back Pedestrian Plazas
-
Pedestrian-Only Streets
-
Shared Streets
Back Shared Streets
-
Commercial Shared Streets
Back Commercial Shared Streets
-
Residential Shared Streets
Back Residential Shared Streets
-
Commercial Shared Streets
-
Neighborhood Streets
Back Neighborhood Streets
-
Residential Streets
Back Residential Streets
-
Neighborhood Main Streets
Back Neighborhood Main Streets
-
Residential Streets
-
Avenues and Boulevards
Back Avenues and Boulevards
-
Central One-Way Streets
Back Central One-Way Streets
-
Central Two-Way Streets
Back Central Two-Way Streets
- Transit Streets
-
Large Streets with Transit
Back Large Streets with Transit
- Grand Streets
-
Central One-Way Streets
-
Special Conditions
Back Special Conditions
-
Elevated Structure Improvement
Back Elevated Structure Improvement
-
Elevated Structure Removal
Back Elevated Structure Removal
-
Streets to Streams
Back Streets to Streams
-
Temporary Street Closures
Back Temporary Street Closures
-
Post-Industrial Revitalization
Back Post-Industrial Revitalization
-
Waterfront and Parkside Streets
Back Waterfront and Parkside Streets
-
Historic Streets
Back Historic Streets
-
Elevated Structure Improvement
-
Streets in Informal Areas
Back Streets in Informal Areas
-
Intersections
Back Intersections
- Intersection Design Strategies
- Intersection Analysis
- Intersection Redesign
- Mini Roundabout
- Small Raised Intersection
- Neighborhood Gateway Intersection
- Intersection of Two-Way and One-Way Streets
- Major Intersection: Reclaiming the Corners
- Major Intersection: Squaring the Circle
- Major Intersection: Cycle Protection
- Complex Intersection: Adding Public Plazas
- Complex Intersection: Improving Traffic Circles
- Complex Intersection: Increasing Permeability
- Resources
- Guides & Publications
- Global Street Design Guide
- Measuring and Evaluating Streets
- How to Measure Streets
How to Measure Streets

Copenhagen, Denmark: Cycle counters on Nørrebrogade bridge track the number of riders per day and year in a city where 45% of all journeys to places of work or education are made by cycle.
If you can’t measure it, you can’t manage it.
—Michael Bloomberg
What to Measure
Measurements can focus on physical and operational changes, shifts in use, as well as their resulting impacts. The tables in Appendix B list potential measurements to evaluate the impact of street projects of various scales. Measure as much as possible, but be strategic in prioritizing time and resources to collect the metrics that most relate to the project goals and community interests.
Once relevant metrics are identified, measure the same categories for the project before and after implementation.
Use the variation between the two sets of data to examine the changes to the street condition, to measure shifts in use and function, and to evaluate the resulting impacts.
Benchmark variations and net changes against prior conditions, other project sites, control areas, citywide data, or other cities, nationally and internationally.
There are three main categories of metrics discussed in this chapter:
- Physical and operational changes: Document new or improved facilities, technologies, and infrastructure to build a database of sustainable streets infrastructure and to track short-term results. Collect quantitative information such as increased length of cycle tracks or transit-only lanes, area of improved sidewalk, or the number of new trees planted. Communicate this information when reporting back to communities, politicians, decision makers, and advocates about progress toward meeting infrastructural targets.
- Shifts in use and function: Measure how a street is used differently as a result of the project. Changes in behavior, new users, enhanced transit flow, and improved functions, such as water management or energy generation, assist in demonstrating how streets can serve a wider percentage of the population and offer multiple benefits to communities.
- Resulting Impacts: Measure how the physical, operational, and functional changes impact the overall performance of the street.1 This longer-term evaluation of a project is an important part of understanding whether an investment or implementation is having the desired outcomes as set forth by the larger goals of public health and safety, quality of life, environmental sustainability, economic sustainability, and equity.
Every metric will not be applicable to all street projects or all contexts. Each community must determine its own priorities and adopt measurements that are relevant and appropriate to the project scale, whether it is an intersection, a street, a corridor, or a neighborhood network project. Some metrics listed are based on commonly available quantitative and qualitative information, while others will need to be collected through agreed-upon methodologies and site surveys.
Identify Existing Data
Work with local stakeholders to identify the types of data already available and collate this data to provide a basis for potential evaluation. Identify opportunities to add questions to existing surveys that are already being conducted, or include new metrics in other stakeholder collection methods.
Consider the following examples as opportunities to investigate local data sources that might relate to streets
projects:
- Local, regional, and national census data or similar surveys might include traffic volumes, major street conditions, and mode share information. They can also include surveys of businesses, residents, retailers, and tourists.
- Police and hospitals track traffic-related fatalities and serious injuries.
- Public health agencies often conduct community health surveys, tracking chronic and respiratory disease rates and daily physical activity levels.
- Insurance agencies track crash rates and hospital admissions.
- Environmental groups and agencies measure water and air quality.
- Advocacy associations, organizations, and academic institutions often maintain a range of data sources.
- Realtors collect information on property values.
- Local governments often have information on tax revenues, property values, and crash statistics.
- Business groups may maintain data on pedestrian volumes and sales.
- Phone call-in systems sometimes collect self-reported street-related issues from citizens.

Develop a Performance Metrics System
Measuring the performance of a street is a complex exercise as each street is different and must serve many needs and functions.2
- Develop a performance measurement system that reflects local priorities and allows for flexibility over time.
- Identify the metrics that will be most easily measured.
- Develop data collection protocols and inventory sheets, determine consistent times and frequencies, and establish ratings that reflect priorities.
- Train local staff and professionals to embed these in local processes and build capacity.
- Maintain consistency, communicate results, and refine the process over time.
Collecting Data
When relevant data does not exist, identify appropriate methodologies for measuring the condition, function, use, and impact of streets. Identify processes
that are efficient and cost-effective.
Quantitative and qualitative metrics are necessary and equally important to measure the various impacts of a project. Counts are helpful for metrics such as user volumes and speeds, but a great deal can be learned from talking to people using the street and conducting surveys of local residents, business owners, and visitors.
Methodologies can include:
- Before-and-after photographs.
- Imaging data such as aerial photos,time-lapse photos, and videos.
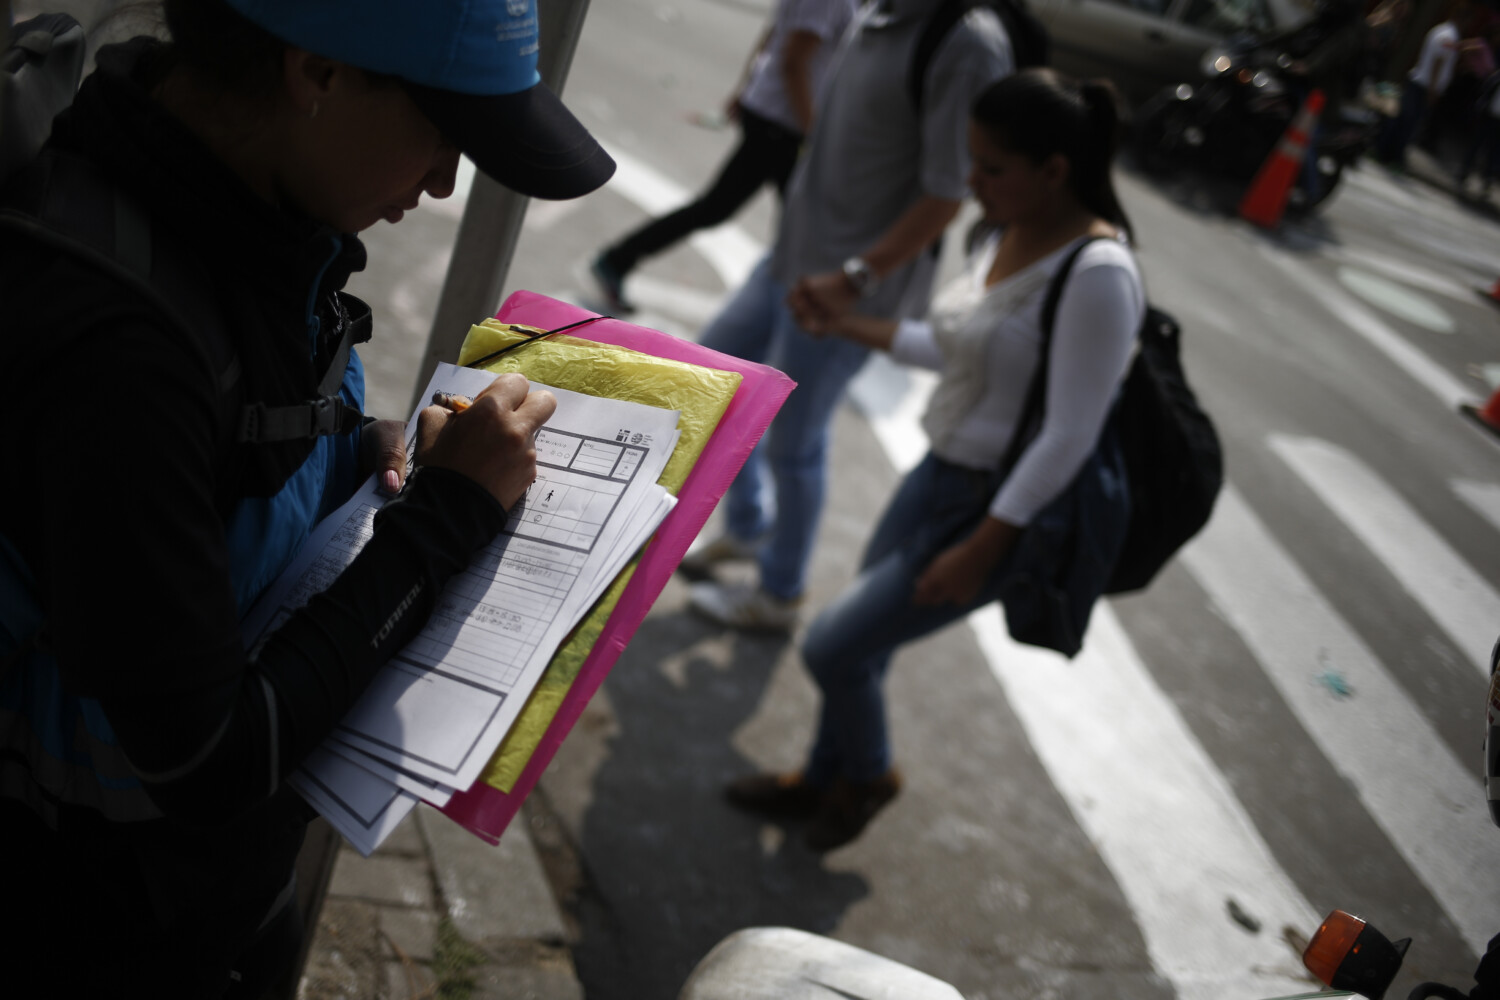
- On-site user perceptions, surveys, or manual counters. Test draft surveys and prioritize questions to match the expected time for responses, whether quick 5-minute interviews or longer 15-minute household surveys. Note locations where surveys were conducted.
- Automated data collection through devices such as Automated Traffic Recorders.
- Crowd-sourced data such as call-in logs and mobile phone GPS data.
When to Measure
Collect data before and after a project to provide comparisons and capture impacts.
Collect measurements during different seasons, at various hours of the day, and during weekends and weekdays to be able to comprehensively compare how the use and function of the street changes after project implementation.
When measuring longer-term changes in function, use, and performance, measurements should be collected after multiple months and years for reliable comparison.
For the most accurate comparisons, be consistent with locations when collecting measurements, as well as times and durations when measuring use and function.


Before-and-after photographs are helpful in reminding people what is possible. Be sure to match views carefully and crop to concentrate on the area of interest.
Footnotes
1. AARP, Evaluating Complete Streets Projects: A guide for practitioners (Washington, DC: AARP, 2015), accessed June 7, 2016, http://www.smartgrowthamerica.org/documents/evaluating-complete-streets-projects.pdf.
2. New York City Department of Transportation. Measuring the Street: New Metrics for 21st Century Streets (New York, NY:NYC DOT, 2012).
US Environmental Protection Agency. Guide to Sustainable Transportation Performance Measures (Washington, DC: EPA, 2011).
Adapted by Global Street Design Guide published by Island Press.
Next Section —